
Important: This documentation is about an older version. It's relevant only to the release noted, many of the features and functions have been updated or replaced. Please view the current version.

Trend
Trend visualizations should be used for datasets that have a sequential, numeric X that is not time. Some examples are function graphs, rpm/torque curves, supply/demand relationships, and elevation or heart rate plots along a race course (with x as distance or duration from start).
Trend visualizations support all visual styles and options available in the time series visualization with these exceptions:
- No annotations or time regions
- No shared cursor/crosshair
- No multi-timezone x axis
- No ability to change the dashboard time range via drag-selection
X Field selection
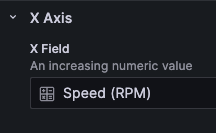
Use this option to select a field that contains increasing numeric values.
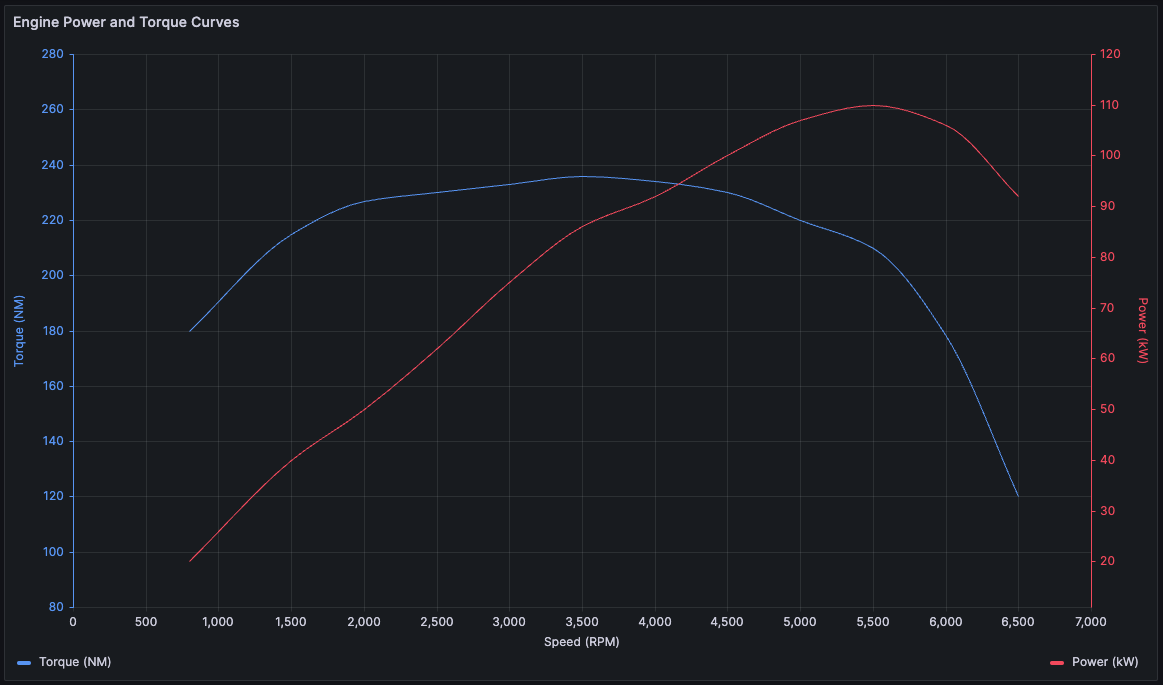
For example, you could represent engine power and torque versus speed where speed is plotted on the x axis and power and torque are plotted on the y axes.
Was this page helpful?
Related resources from Grafana Labs



