
Important: This documentation is about an older version. It's relevant only to the release noted, many of the features and functions have been updated or replaced. Please view the current version.

View alert rules
The Alert rules list view page lists all existing recording and alert rules, including those created in Grafana and those available in configured data sources.
To access the Alert rules page, click Alerts & IRM -> Alerting -> Alert rules.
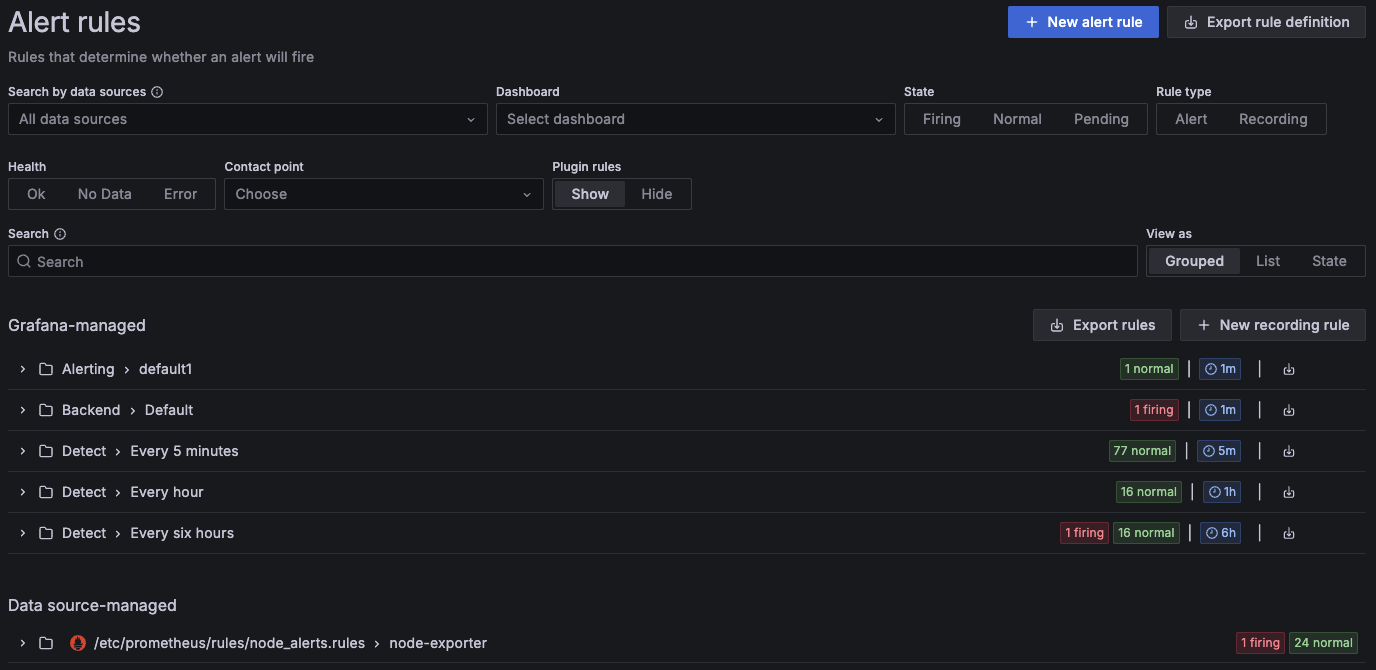
By default, alert rules are grouped by alert rule type: Grafana-managed or data source-managed.
In this view, you can find and edit rules created in Grafana. However, rules created in Prometheus-compatible data sources are displayed but cannot be edited.
This view includes filters to simplify managing large volumes of alerts.
You can filter by data sources, dashboards, and alert rule properties such as state, type, health, and contact points. The Search input allows you to filter by additional parameters like folders, evaluation groups, labels, and more.
You can also change how the rule list is displayed using the View as option.
Grouped: Displays Grafana rules grouped by folder and evaluation group, and data-source rules by namespace and evaluation group. This is the default view.
List: Displays Grafana rules grouped only by folder.
State: Displays rules grouped by state, providing an overview for each state.
Select a group to expand it and view the list of alert rules within that group.
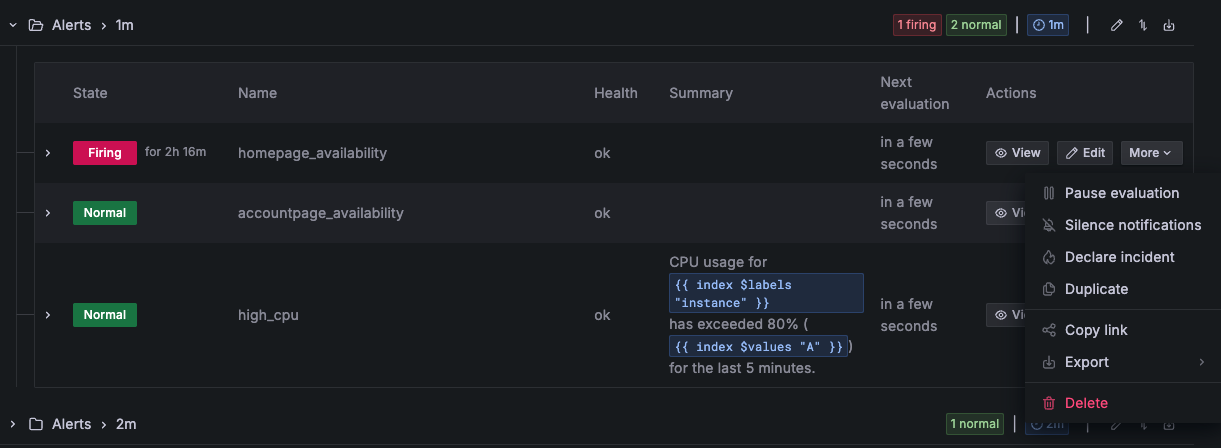
For details on how rule states and alert instance states are displayed, refer to View alert state.
Was this page helpful?
Related resources from Grafana Labs



