
Important: This documentation is about an older version. It's relevant only to the release noted, many of the features and functions have been updated or replaced. Please view the current version.

Zipkin data source
Grafana ships with built-in support for Zipkin, an open source, distributed tracing system. Just add it as a data source and you are ready to query your traces in Explore.
Adding the data source
To access Zipkin settings, click the Configuration (gear) icon, then click Data Sources, and then click Zipkin.
Query traces
Querying and displaying traces from Zipkin is available via Explore.

The Zipkin query editor allows you to query by trace ID directly or selecting a trace from trace selector. To query by trace ID, insert the ID into the text input.
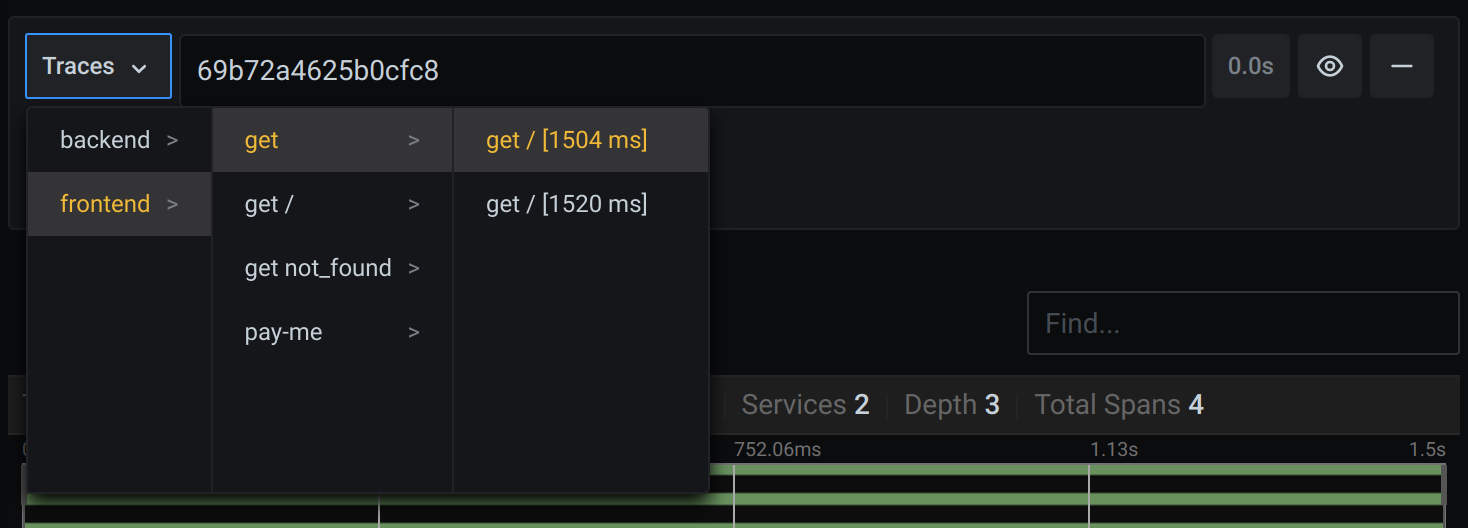
Use the trace selector to pick particular trace from all traces logged in the time range you have selected in Explore. The trace selector has three levels of nesting:
- The service you are interested in.
- Particular operation is part of the selected service
- Specific trace in which the selected operation occurred, represented by the root operation name and trace duration.
Data mapping in the trace UI
Zipkin annotations are shown in the trace view as logs with annotation value shown under annotation key.
Linking Trace ID from logs
You can link to Zipkin trace from logs in Loki by configuring a derived field with internal link. See Loki documentation for details.
Was this page helpful?
Related resources from Grafana Labs



