
Important: This documentation is about an older version. It's relevant only to the release noted, many of the features and functions have been updated or replaced. Please view the current version.

Usage insights
Usage insights allow you to have a better understanding of how your Grafana instance is used. The collected data are the number of:
- Dashboard views (aggregated and per user)
- Data source errors
- Data source queries
Only available in Grafana Enterprise v7.0+.
Presence indicator
The presence indicator is visible to all signed-in users on all dashboards. It shows the avatars of users who interacted with the dashboard recently (last 10 minutes by default). You can see the user’s name by hovering your cursor over the user’s avatar. The avatars come from Gravatar based on the user’s email.
When more users are active on a dashboard than can fit in the presence indicator section, click on the +X icon that opens dashboard insights to see more details about recent user activity.

You can choose your own definition of “recent” by setting it in the configuration file.
[analytics.views]
# Set age for recent active users
recent_users_age = 10m
Dashboard insights
You can see dashboard usage information by clicking on the Dashboard insights button in the top bar.

It shows two kinds of information:
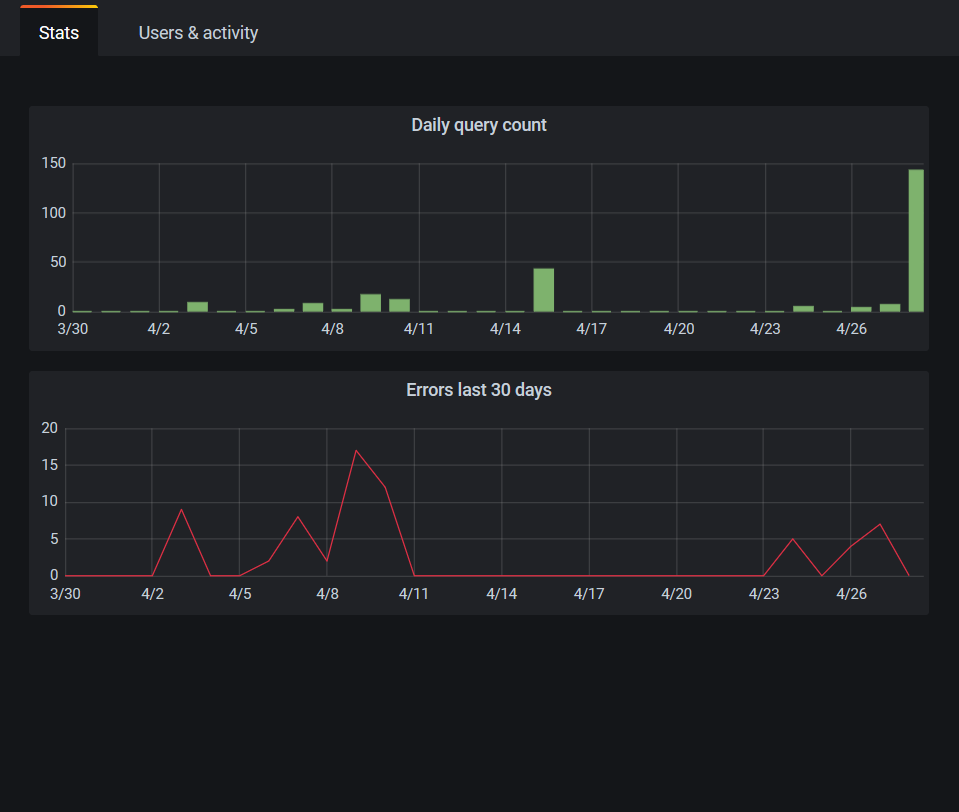
- Stats: Shows the daily query count and error count for the last 30 days.
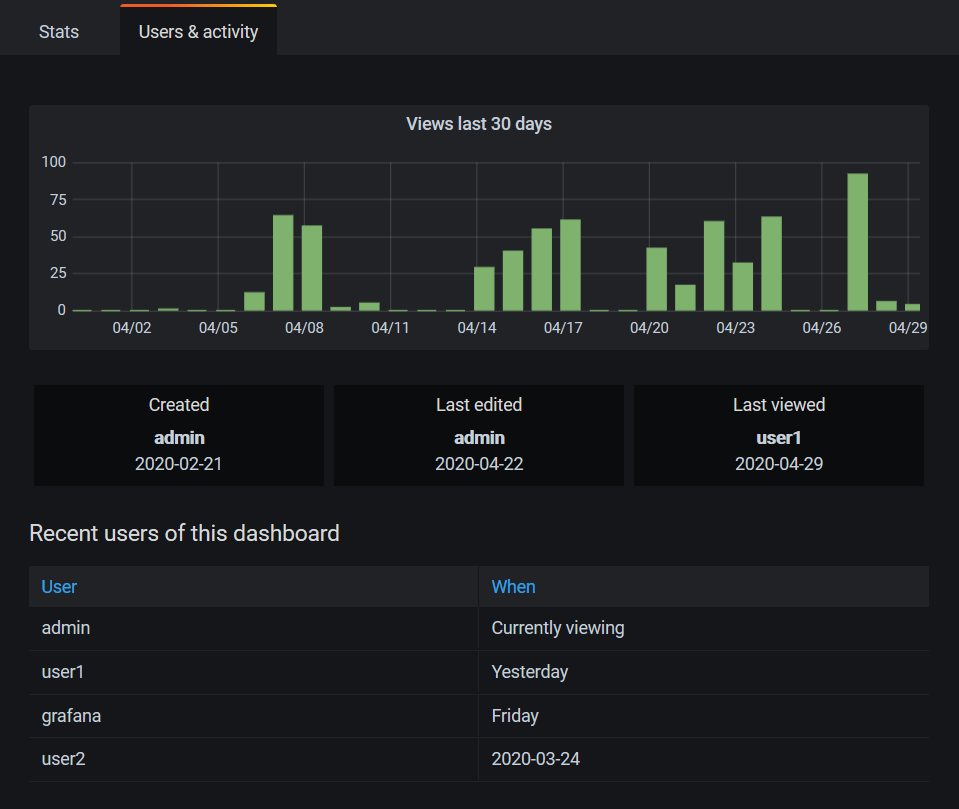
- Users & activity: Shows the daily view count for the last 30 days; last activities on the dashboard and recent users (with a limit of 20).
Improved dashboard search
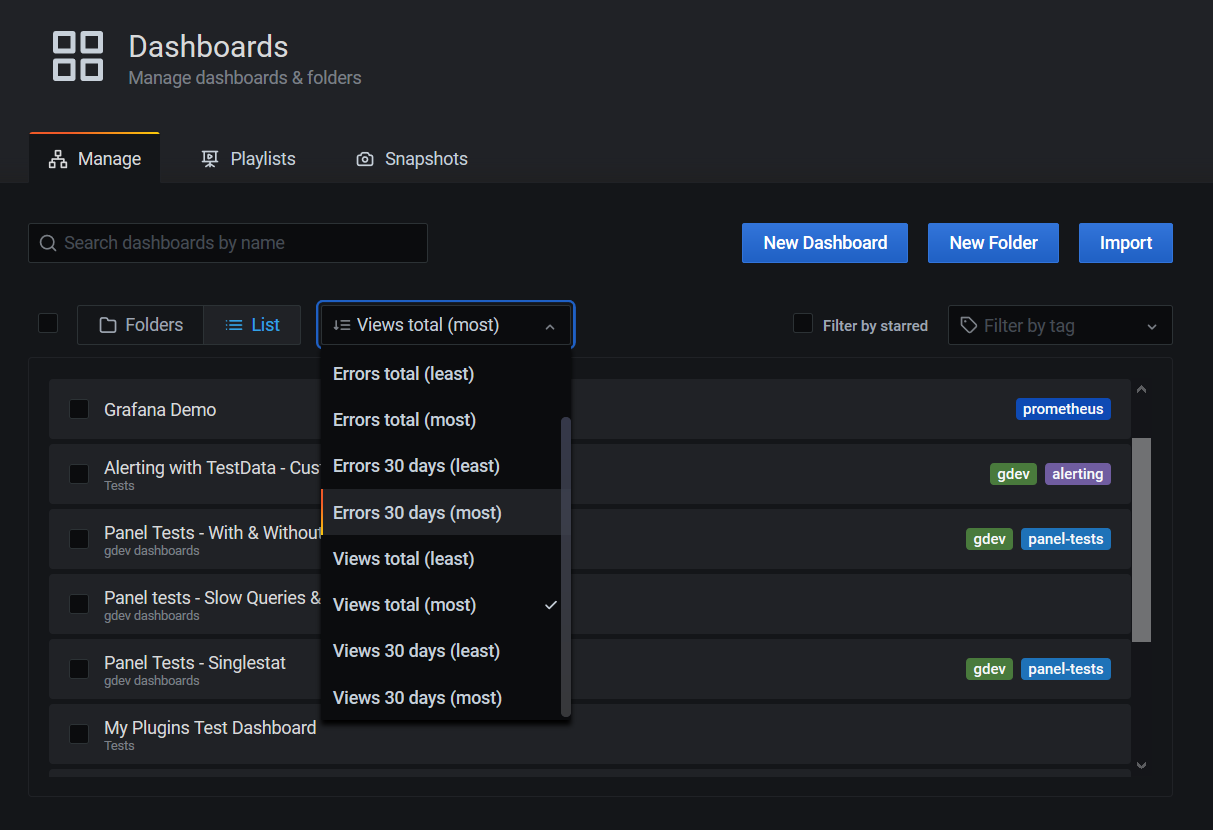
In the search view, you can sort dashboards using these insights data. It helps you find unused or broken dashboards or discover most viewed ones.
Was this page helpful?
Related resources from Grafana Labs



