
Menu
Important: This documentation is about an older version. It's relevant only to the release noted, many of the features and functions have been updated or replaced. Please view the current version.

Enterprise
Open source
Gauge panel
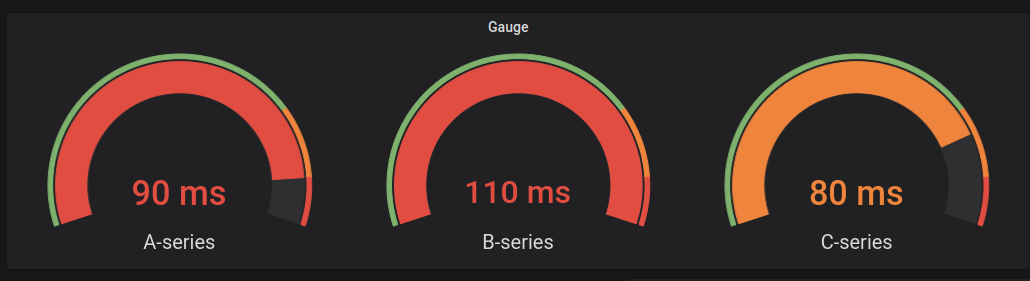
Gauge is a single value panel that can repeat a gauge for every series, column or row.
Data and field options
Gauge visualizations allow you to apply:
Display options
Use the following options to refine your visualization:
- Show - Choose how Grafana displays your data.
- Calculate - Show a calculated Value based on all rows. For a list of available calculations, refer to List of calculations.
- All values - Show a separate stat for every row. If you select this option, then you can also select a Limit, or the maximum number of rows to display.
- Orientation - Choose a stacking direction.
- Auto - Grafana selects what it thinks is the best orientation.
- Horizontal - Bars stretch horizontally, left to right.
- Vertical - Bars stretch vertically, top to bottom.
- Show threshold labels - Controls if threshold values are shown.
- Show threshold markers - Controls if a threshold band is shown outside the inner gauge value band.
Was this page helpful?
Related resources from Grafana Labs

Video

Getting started with managing your metrics, logs, and traces using Grafana
In this webinar, we’ll demo how to get started using the LGTM Stack: Loki for logs, Grafana for visualization, Tempo for traces, and Mimir for metrics.
Video

Getting started with Grafana dashboard design
In this webinar, you'll learn how to design stylish and easily accessible Grafana dashboards that tell a story.
Video

Building advanced Grafana dashboards
In this webinar, we’ll demo how to build and format Grafana dashboards.