
Important: This documentation is about an older version. It's relevant only to the release noted, many of the features and functions have been updated or replaced. Please view the current version.

Logs panel
The logs panel visualization shows log lines from data sources that support logs, such as Elastic, Influx, and Loki. Typically you would use this panel next to a graph panel to display the log output of a related process.
Note: The Logs panel is only available in Grafana v6.4+.
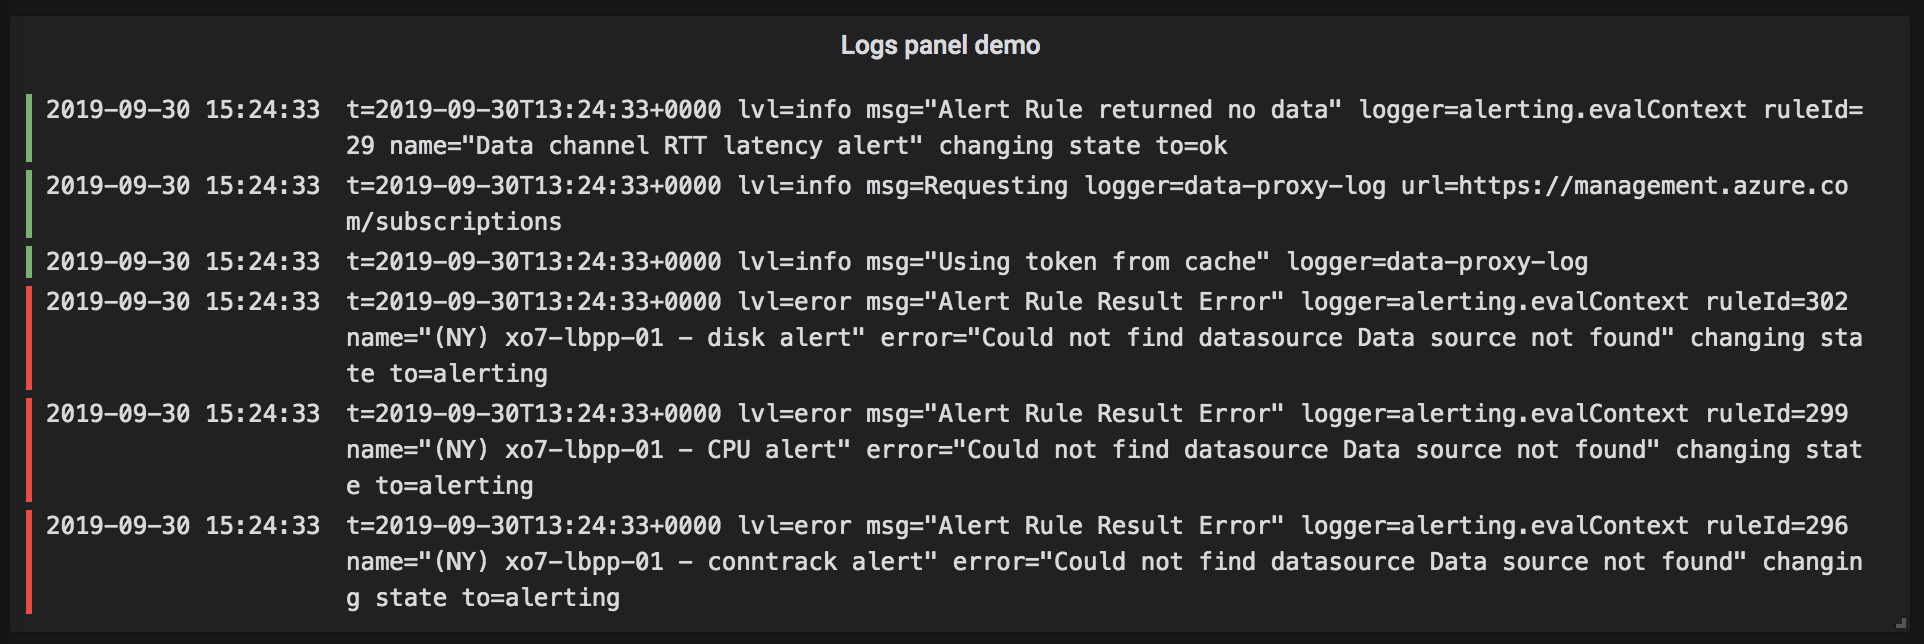
The logs panel shows the result of queries that were entered in the Query tab. The results of multiple queries are merged and sorted by time. You can scroll inside the panel if the data source returns more lines than can be displayed at any one time.
To limit the number of lines rendered, you can use the Max data points setting in the Query options. If it is not set, then the data source will usually enforce a default limit.
Display options
Use these settings to refine your visualization:
- Time - Show or hide the time column. This is the timestamp associated with the log line as reported from the data source.
- Unique labels - Show or hide the unique labels column, which shows only non-common labels.
- Wrap lines - Toggle line wrapping.
- Order - Display results in descending or ascending time order. The default is Descending, showing the newest logs first. Set to Ascending to show the oldest log lines first.
Was this page helpful?
Related resources from Grafana Labs



