
Important: This documentation is about an older version. It's relevant only to the release noted, many of the features and functions have been updated or replaced. Please view the current version.
 Grafana documentation
Panels
Visualizations
Time series panel
Graph time series as points
Grafana documentation
Panels
Visualizations
Time series panel
Graph time series as pointsGraph time series as points
Note: This is a beta feature. Time series panel is going to replace the Graph panel in the future releases.
This section explains how to use Time series field options to visualize time series data as points and illustrates what the options do.
Create the panel
- Add a panel. Select the Time series visualization.
- In the Panel editor, click the Field tab..
- In Style, click Points.
Style the points
Use the following field settings to refine your visualization.
For more information about applying these options, refer to:
Some field options will not affect the visualization until you click outside of the field option box you are editing or press Enter.
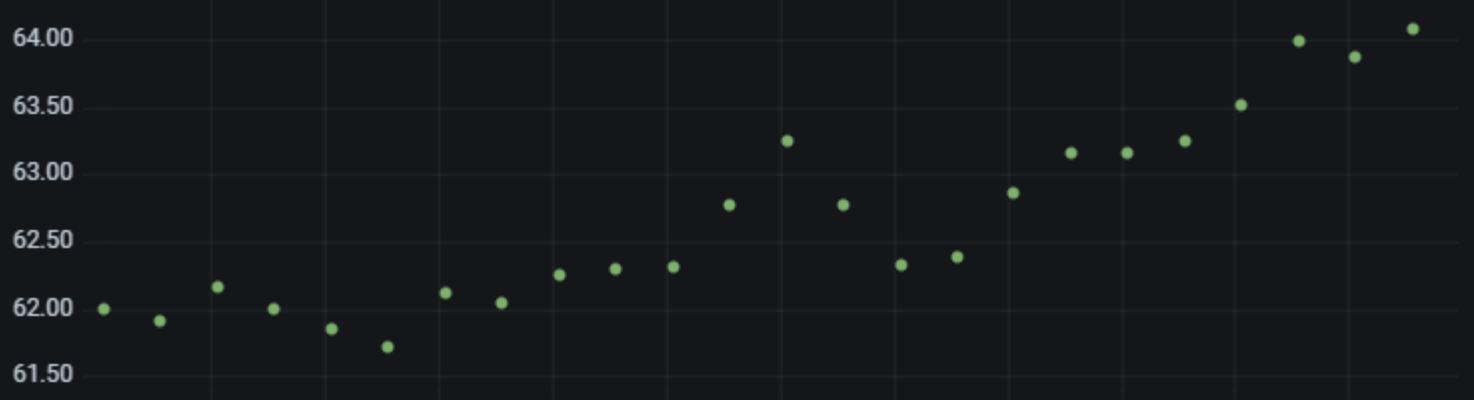
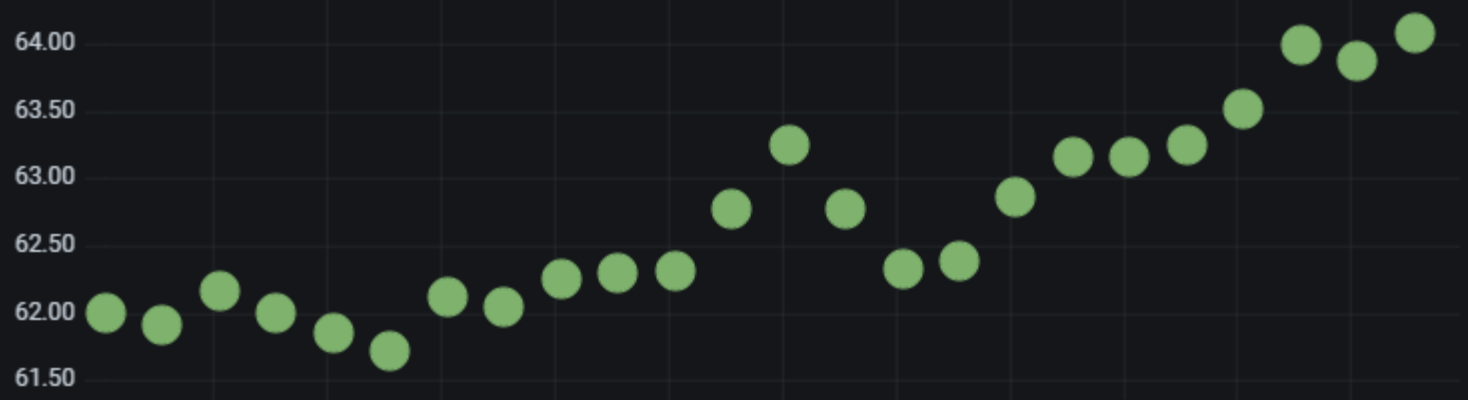
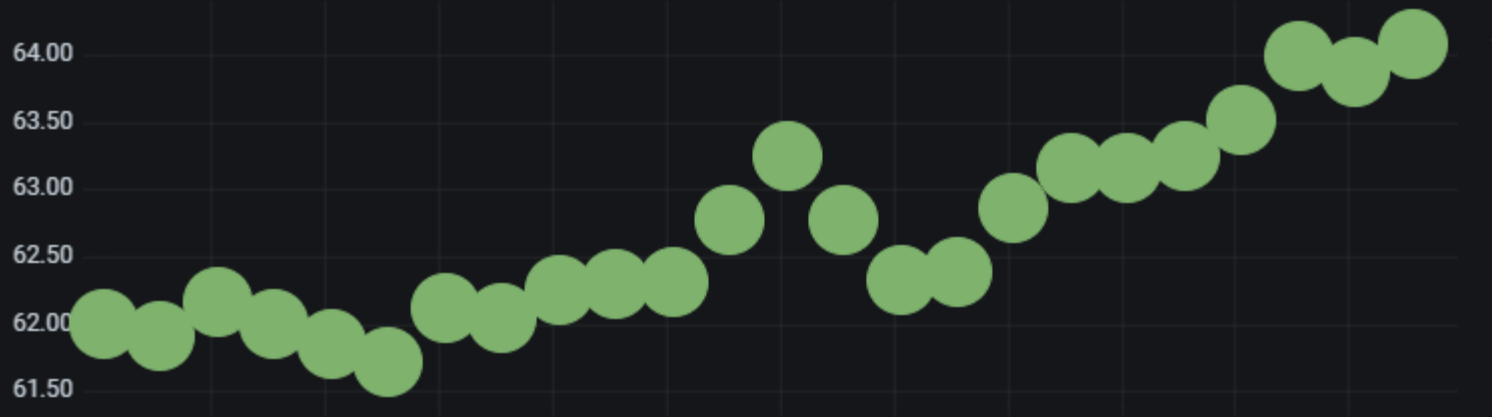
Point size
Set the size of the points, from 1 to 40 pixels in diameter.
Point size set to 6:
Point size set to 20:
Point size set to 35:
Was this page helpful?
Related resources from Grafana Labs



