
Important: This documentation is about an older version. It's relevant only to the release noted, many of the features and functions have been updated or replaced. Please view the current version.

Troubleshoot alerts
If alerts are not behaving as you expect, here are some steps you can take to troubleshoot and figure out what is going wrong.
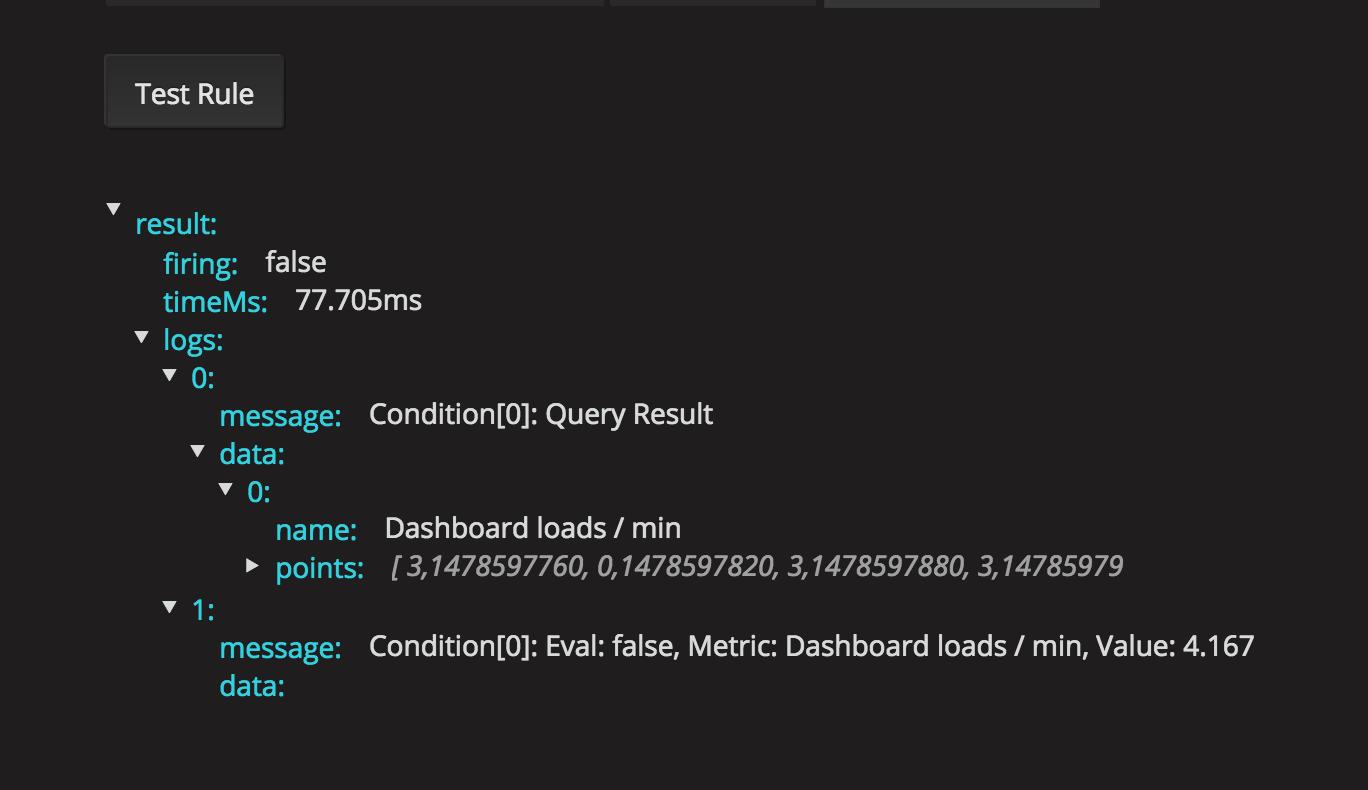
The first level of troubleshooting you can do is click Test Rule. You will get result back that you can expand to the point where you can see the raw data that was returned from your query.
Further troubleshooting can also be done by inspecting the grafana-server log. If it’s not an error or for some reason the log does not say anything you can enable debug logging for some relevant components. This is done in Grafana’s ini config file.
Example showing loggers that could be relevant when troubleshooting alerting.
[log]
filters = alerting.scheduler:debug \
          alerting.engine:debug \
          alerting.resultHandler:debug \
          alerting.evalHandler:debug \
          alerting.evalContext:debug \
          alerting.extractor:debug \
          alerting.notifier:debug \
          alerting.notifier.slack:debug \
          alerting.notifier.pagerduty:debug \
          alerting.notifier.email:debug \
          alerting.notifier.webhook:debug \
          tsdb.graphite:debug \
          tsdb.prometheus:debug \
          tsdb.opentsdb:debug \
          tsdb.influxdb:debug \
          tsdb.elasticsearch:debug \
          tsdb.elasticsearch.client:debug \
If you want to log raw query sent to your TSDB and raw response in log you also have to set grafana.ini option app_mode to development.
Was this page helpful?
Related resources from Grafana Labs



