
Important: This documentation is about an older version. It's relevant only to the release noted, many of the features and functions have been updated or replaced. Please view the current version.

Grafana TestData DB
The purpose of this data source is to make it easier to create fake data for any panel.
Using TestData DB you can build your own time series and have any panel render it.
This makes it much easier to verify functionality since the data can be shared very easily.
Enable
The TestData DB data source is not enabled by default. To enable it:
- In the Configuration menu (small gear on the left side of the screen), click Data Sources.
- Click Add Data Source.
- Search and click
TestData DB. - Click Save & Test to enable it.
Create mock data.
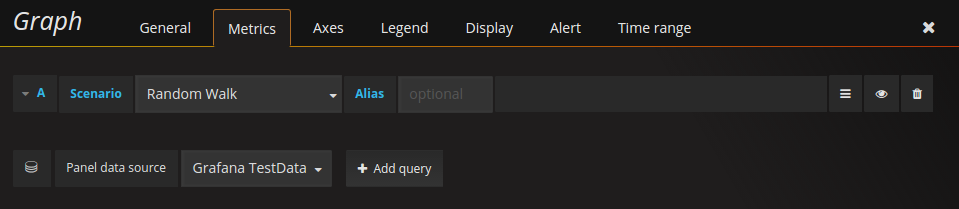
Once TestData DB is enabled, you can use it as a data source in any metric panel.
CSV
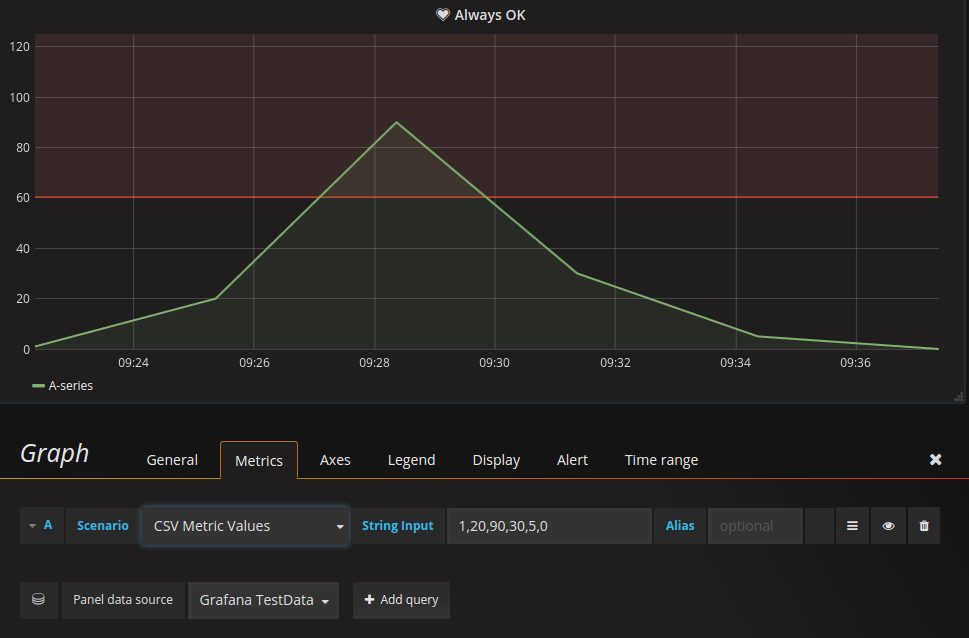
The comma separated values scenario is the most powerful one since it lets you create any kind of graph you like.
Once you provided the numbers, TestData DB distributes them evenly based on the time range of your query.
Dashboards
TestData DB also contains some dashboards with examples.
- Click Configuration > Data Sources > TestData DB > Dashboards.
- Import the Simple Streaming Example dashboard.
Commit updates to the dashboards
To submit a change to one of the current dashboards bundled with TestData DB, update the revision property.
Otherwise the dashboard will not be updated automatically for other Grafana users.
Using test data in issues
If you post an issue on Github regarding time series data or rendering of time series data, we strongly advise you to use this data source to replicate the data. That makes it much easier for the developers to replicate and solve the issue you have.
Was this page helpful?
Related resources from Grafana Labs



