
Important: This documentation is about an older version. It's relevant only to the release noted, many of the features and functions have been updated or replaced. Please view the current version.

Panel overview
The panel is the basic visualization building block in Grafana. Each panel has a query editor specific to the data source selected in the panel. The query editor allows you to extract the perfect visualization to display on the panel.
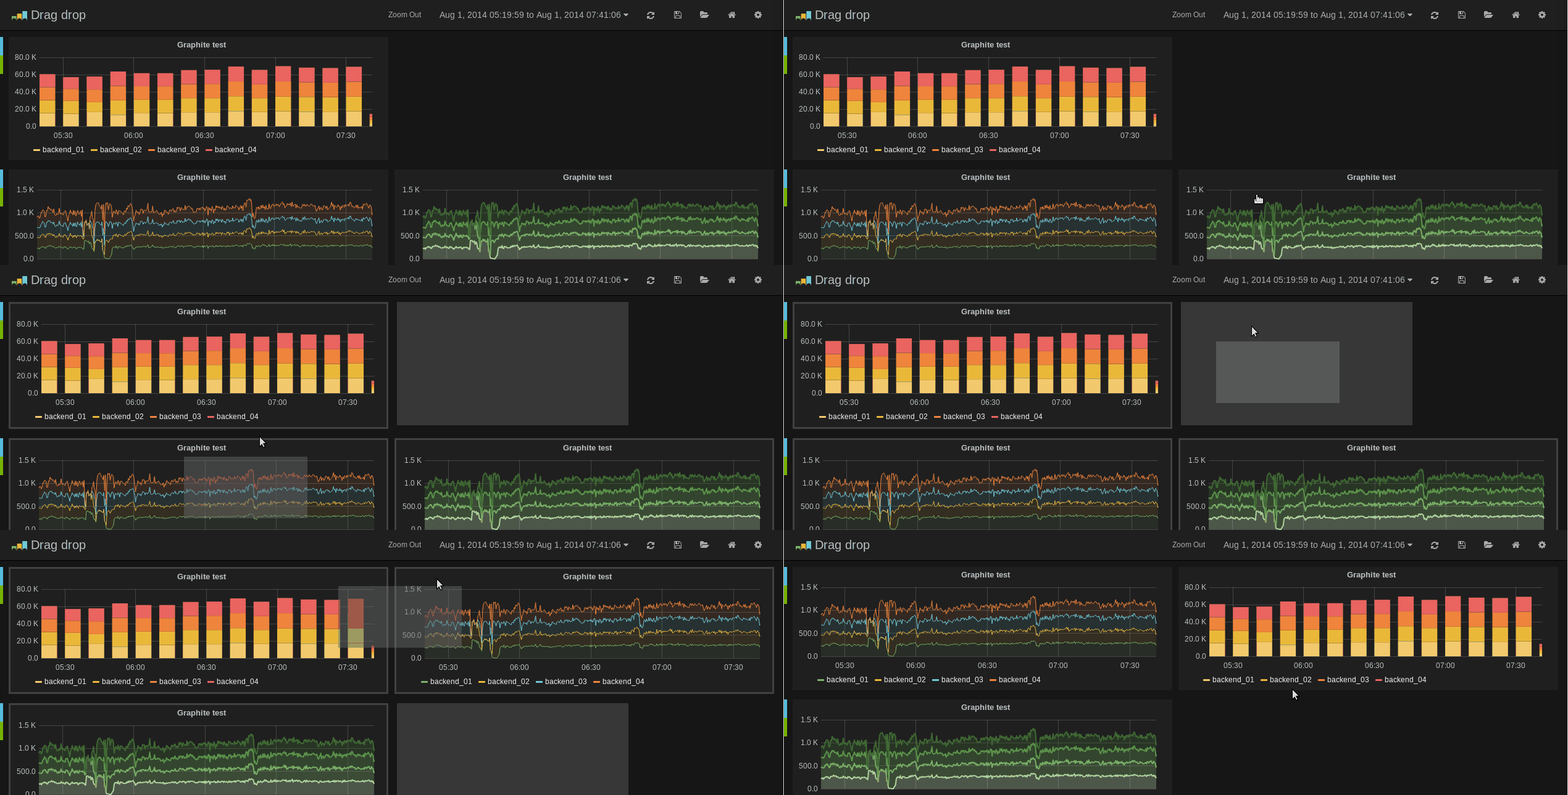
There are a wide variety of styling and formatting options for each panel. Panels can be dragged and dropped and rearranged on the dashboard. They can also be resized.
Move panels
You can drag and drop panels by clicking and holding the panel title, then dragging it to its new location. You can also easily resize panels by clicking the (-) and (+) icons.
Tips and shortcuts
- Click the graph title and in the dropdown menu quickly duplicate the panel.
- Click the colored icon in the legend to change a series color or the y-axis.
- Click series name in the legend to hide series.
- Ctrl/Shift/Meta + click legend name to hide other series.
- Hover your cursor over a panel and press
eto open the panel editor. - Hover your cursor over a panel and press
vto open the panel in full screen view.
Was this page helpful?
Related resources from Grafana Labs



