
Important: This documentation is about an older version. It's relevant only to the release noted, many of the features and functions have been updated or replaced. Please view the current version.

Legend options
Use the legend to adjust how a visualization displays series. This legend functionality only applies to a few panels now, but it will eventually be common to all visualizations.
This topic currently applies to the following visualizations:
Toggle series
To toggle a series: Click on the series label in the legend to isolate the series in the visualization. All other series are hidden in the visualization. The data of the hidden series is still accessible.
Use Cmd/Ctrl+click on the series label to hide the isolated series and remove the toggle.
Note: This option is persistent when you save the dashboard.
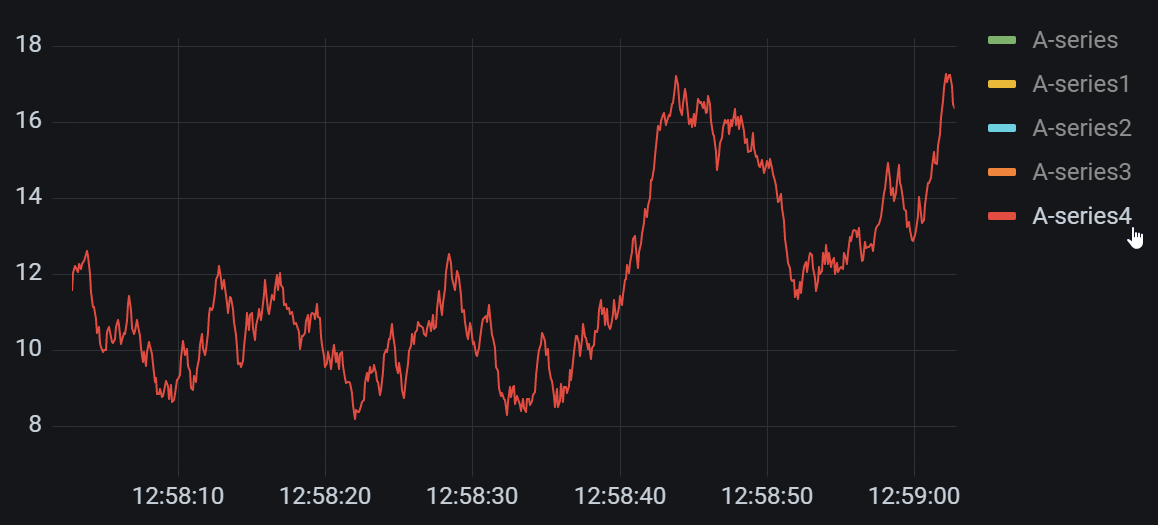
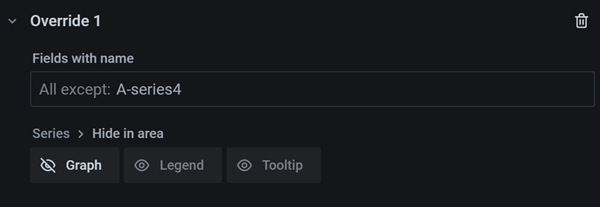
This creates a system override that hides the other series. You can view this override in the Overrides tab. If you delete the override, then it removes the toggle.
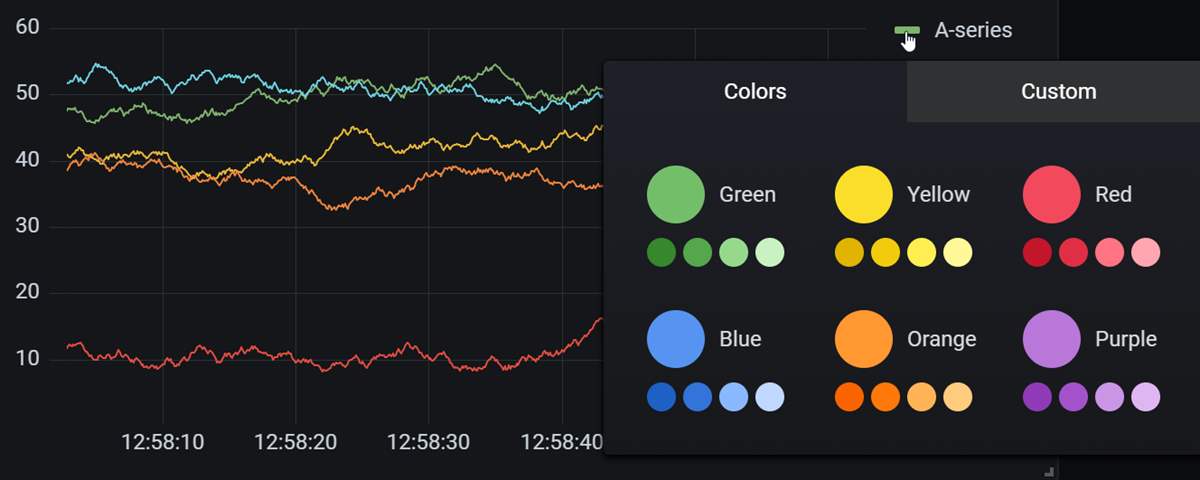
Change series color
Click on the series icon (colored line beside the series label) in the legend to change selected series color.
Was this page helpful?
Related resources from Grafana Labs



