
Menu
Important: This documentation is about an older version. It's relevant only to the release noted, many of the features and functions have been updated or replaced. Please view the current version.

Enterprise
Open source
Working with Grafana dashboard UI
Note: Looking for prebuilt Grafana dashboards? Check out our full library of dashboards and more →
The dashboard UI has the following sections to allow you to customize the presentation of data.
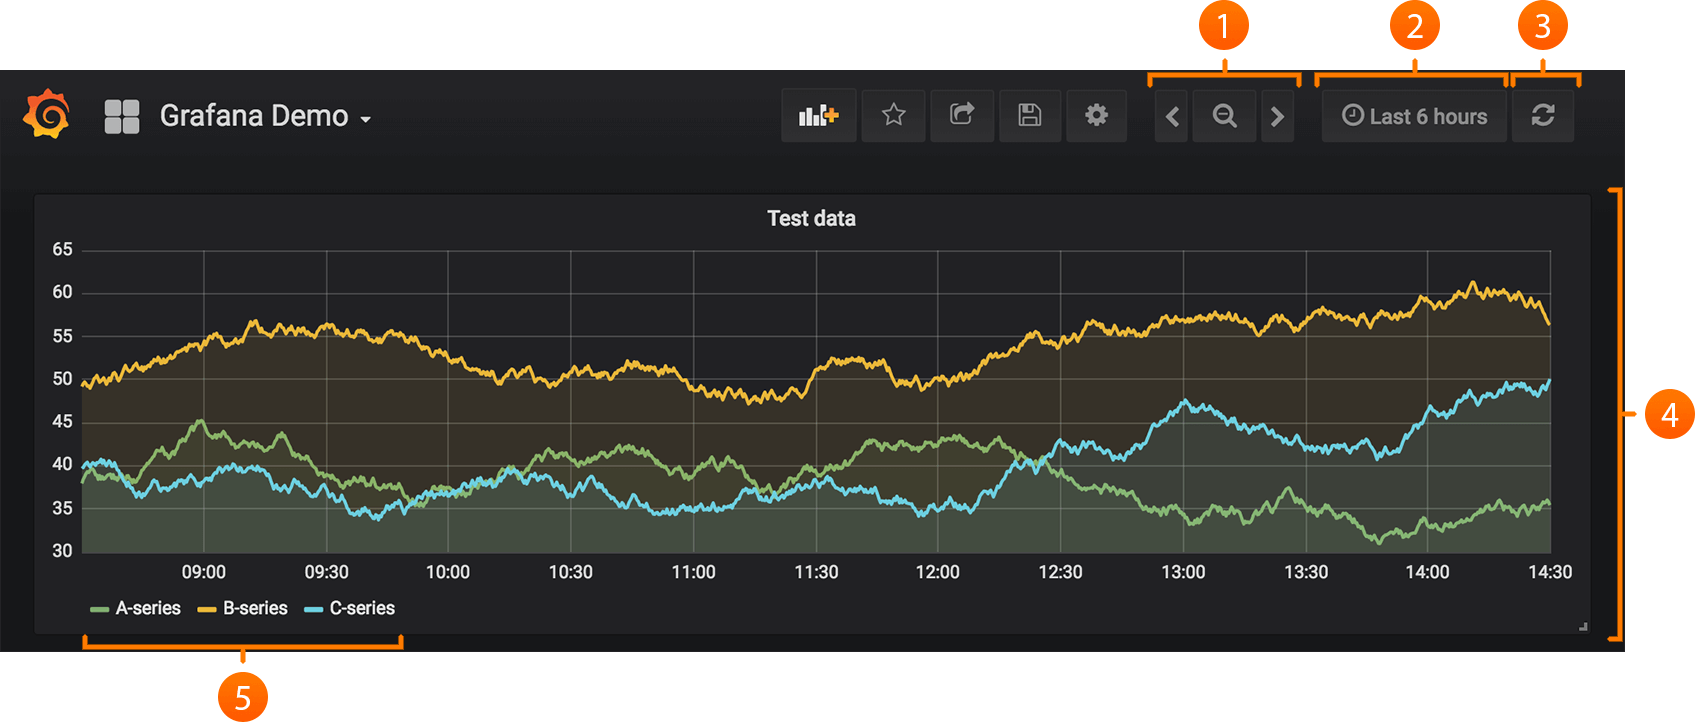
- Zoom out time range (1)
- Time picker dropdown (2). Access relative time range options, auto refresh options and set custom absolute time ranges.
- Manual refresh option (3) Fetch new data.
- Dashboard panel (4) Click the panel title to edit panels.
- Graph legend (5) Change series colors, y-axis and series visibility directly from the legend.
For more details, see Dashboard header and Dashboard rows.
Was this page helpful?
Related resources from Grafana Labs

Video

Getting started with managing your metrics, logs, and traces using Grafana
In this webinar, we’ll demo how to get started using the LGTM Stack: Loki for logs, Grafana for visualization, Tempo for traces, and Mimir for metrics.
Video

Getting started with Grafana dashboard design
In this webinar, you'll learn how to design stylish and easily accessible Grafana dashboards that tell a story.
Video

Building advanced Grafana dashboards
In this webinar, we’ll demo how to build and format Grafana dashboards.