
Important: This documentation is about an older version. It's relevant only to the release noted, many of the features and functions have been updated or replaced. Please view the current version.

Add a data source
Before you can create your first dashboard, you need to add your data source.
Note: Only users with the organization Admin role can add data sources.
To add a data source:
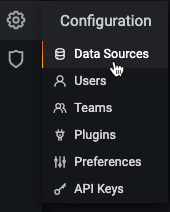
Move your cursor to the cog icon on the side menu which will show the configuration options.
![]()
Click on Data sources. The data sources page opens showing a list of previously configured data sources for the Grafana instance.
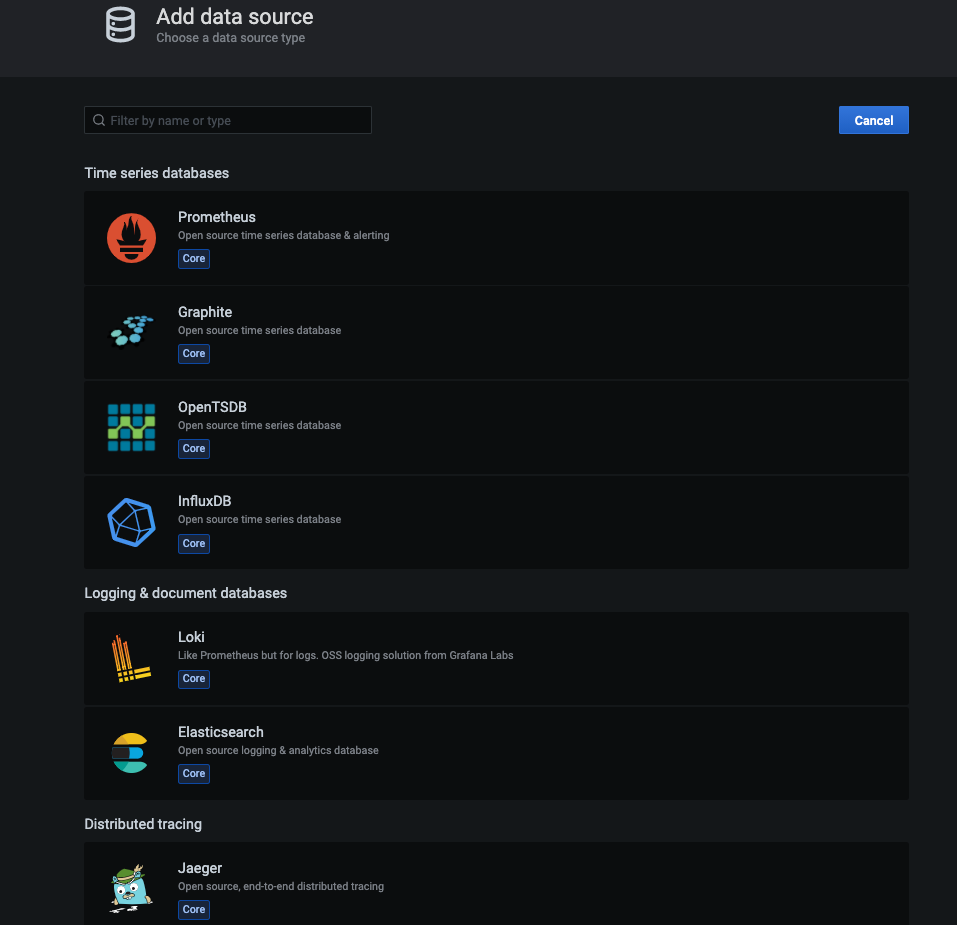
Click Add data source to see a list of all supported data sources.
![]()
Search for a specific data source by entering the name in the search dialog. Or you can scroll through supported data sources grouped into time series, logging, tracing and other categories.
Move the cursor over the data source you want to add.
![]()
Click Select. The data source configuration page opens.
Configure the data source following instructions specific to that data source. See Data sources for links to configuration instructions for all supported data sources.

Was this page helpful?
Related resources from Grafana Labs



