
Menu
Important: This documentation is about an older version. It's relevant only to the release noted, many of the features and functions have been updated or replaced. Please view the current version.

Enterprise
Open source
Organize a dashboard
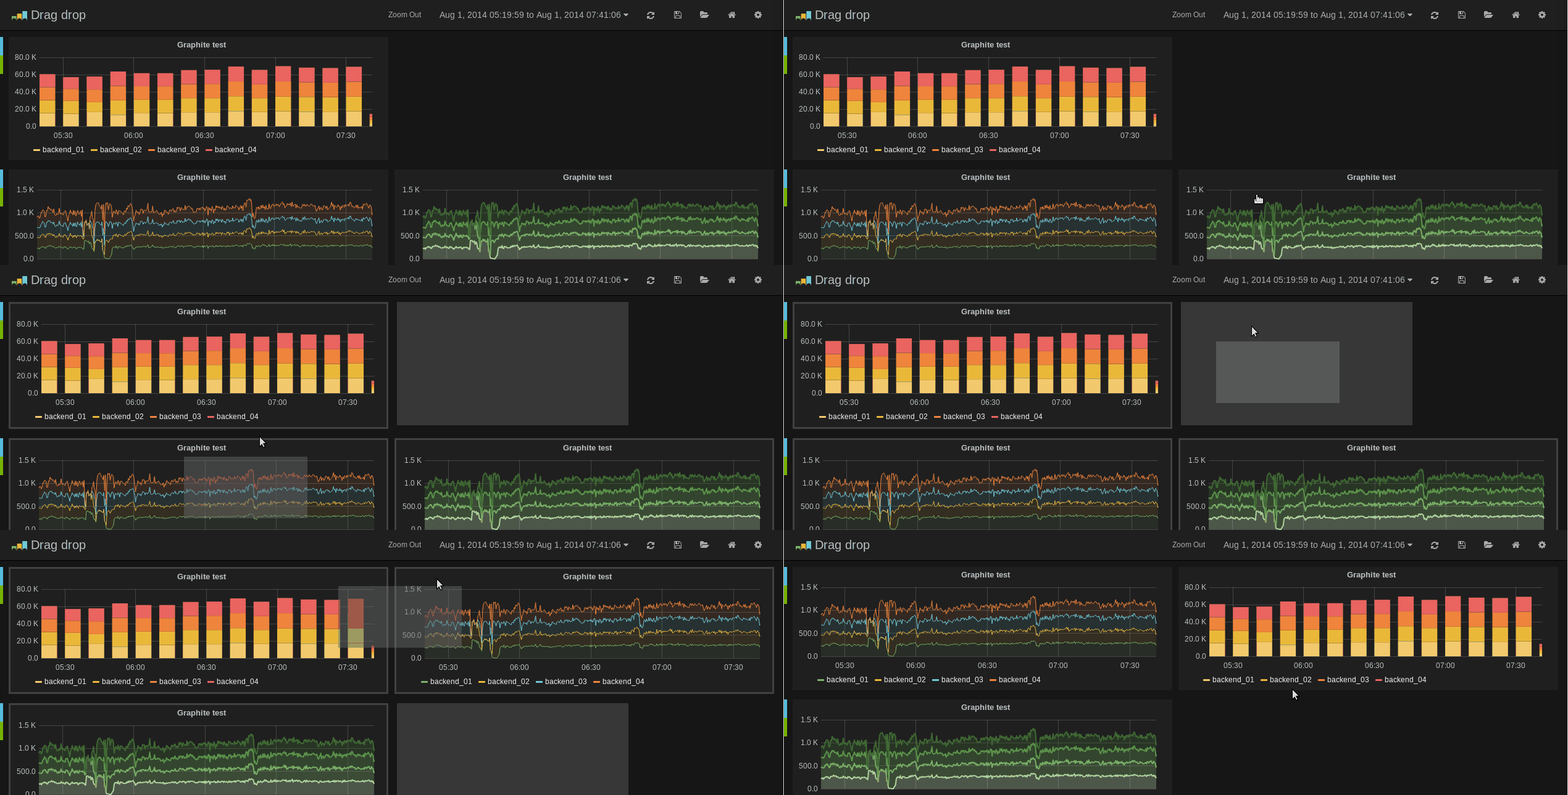
You can place any panel in any location you want and controls its size. The changes you make impact other users of the dashboard.
Before you begin
- Add two or more panels
- Ensure that you sign in with Editor permissions
To organize a dashboard:
Hover your cursor over the panel, and click-and-drag the panel to its new location.
To resize a panel, click the zoom in (+) and zoom out (-) icons.
Tips and shortcuts
- Click the graph title and in the dropdown menu quickly duplicate the panel.
- Click the colored icon in the legend to change a series color or the y-axis.
- Click series name in the legend to hide series.
- Ctrl/Shift/Meta + click legend name to hide other series.
- Hover your cursor over a panel and press
eto open the panel editor. - Hover your cursor over a panel and press
vto open the panel in full screen view..
Was this page helpful?
Related resources from Grafana Labs

Video

Getting started with managing your metrics, logs, and traces using Grafana
In this webinar, we’ll demo how to get started using the LGTM Stack: Loki for logs, Grafana for visualization, Tempo for traces, and Mimir for metrics.
Video

Getting started with Grafana dashboard design
In this webinar, you'll learn how to design stylish and easily accessible Grafana dashboards that tell a story.
Video

Building advanced Grafana dashboards
In this webinar, we’ll demo how to build and format Grafana dashboards.