
Menu
Important: This documentation is about an older version. It's relevant only to the release noted, many of the features and functions have been updated or replaced. Please view the current version.
Documentation Grafana documentation
Grafana Enterprise
Usage insights
Dashboard and data source insights
Grafana documentation
Grafana Enterprise
Usage insights
Dashboard and data source insights
Grafana documentation
Grafana Enterprise
Usage insights
Dashboard and data source insightsEnterprise
Open source
Dashboard and data source insights
For every dashboard and data source, you can access usage information.
Dashboard insights
Note: Available in Grafana Enterprise version 7.0 and later, and Grafana Cloud Pro and Advanced.
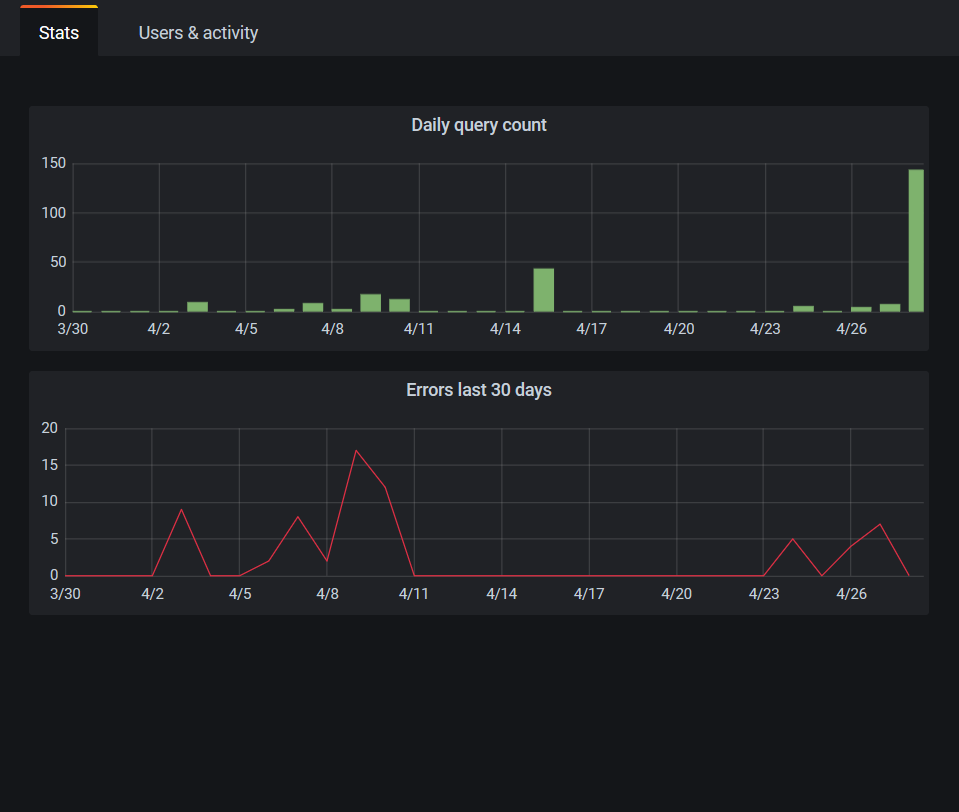
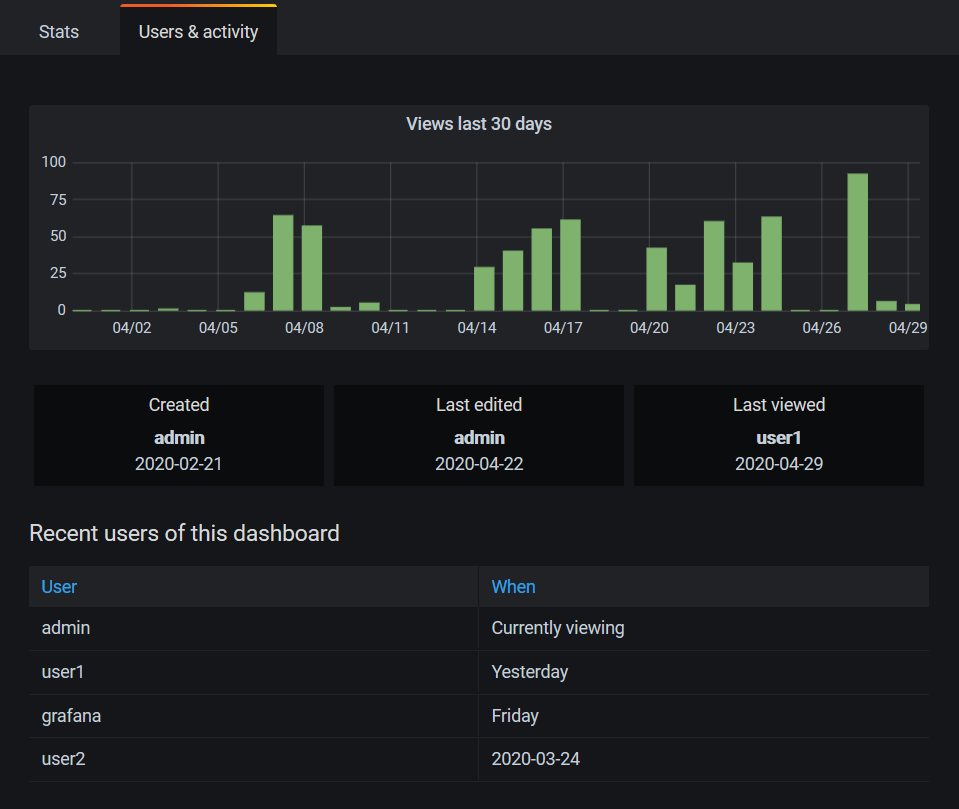
To see dashboard usage information, go to the top bar and click Dashboard insights.

Dashboard insights show the following information:
- Stats: The number of daily queries and errors for the past 30 days.
- Users & activity: The daily view count for the last 30 days; last activities on the dashboard and recent users (with a limit of 20).
Data source insights
Note: Available in Grafana Enterprise version 7.3 and later, and Grafana Cloud Pro and Advanced.
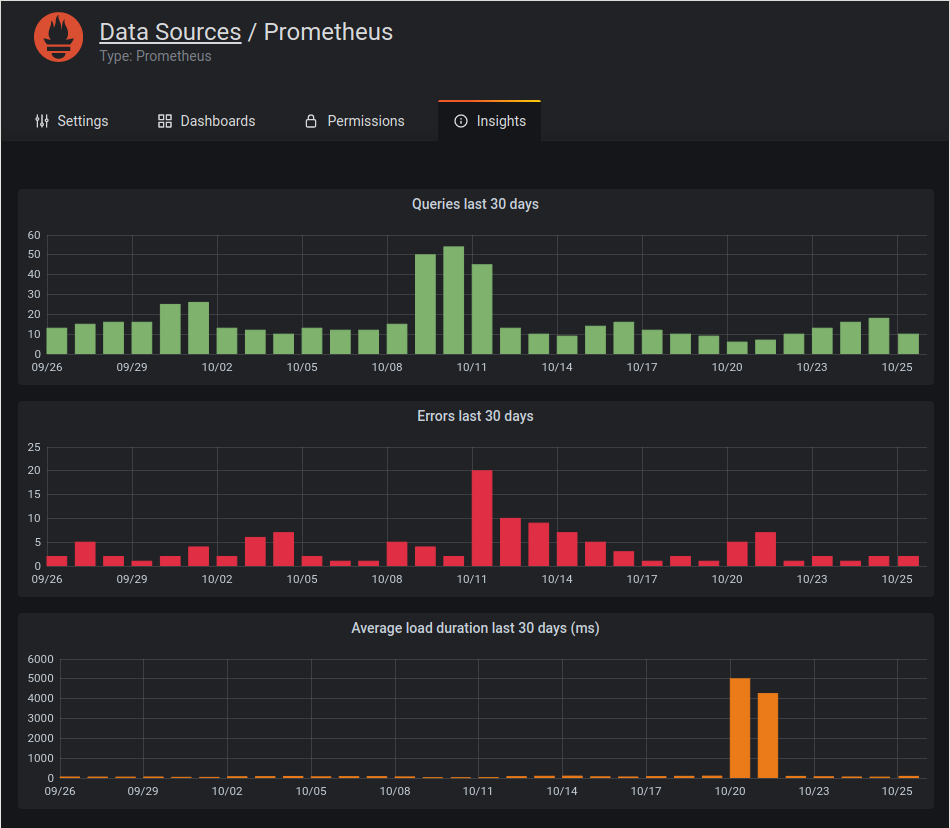
Data source insights give you information about how a data source has been used in the past 30 days, such as:
- Queries per day
- Errors per day
- Query load time per day (averaged in ms)
To find data source insights:
- Go to the Data source list view.
- Click on a data source.
- Click the Insights tab.
Was this page helpful?
Related resources from Grafana Labs

Video

Getting started with managing your metrics, logs, and traces using Grafana
In this webinar, we’ll demo how to get started using the LGTM Stack: Loki for logs, Grafana for visualization, Tempo for traces, and Mimir for metrics.
Video

Getting started with Grafana dashboard design
In this webinar, you'll learn how to design stylish and easily accessible Grafana dashboards that tell a story.
Video

Building advanced Grafana dashboards
In this webinar, we’ll demo how to build and format Grafana dashboards.