
Important: This documentation is about an older version. It's relevant only to the release noted, many of the features and functions have been updated or replaced. Please view the current version.

Set up Grafana for high availability
Setting up Grafana for high availability is fairly simple. You just need a shared database for storing dashboard, users, and other persistent data. So the default embedded SQLite database will not work, you will have to switch to MySQL or Postgres.
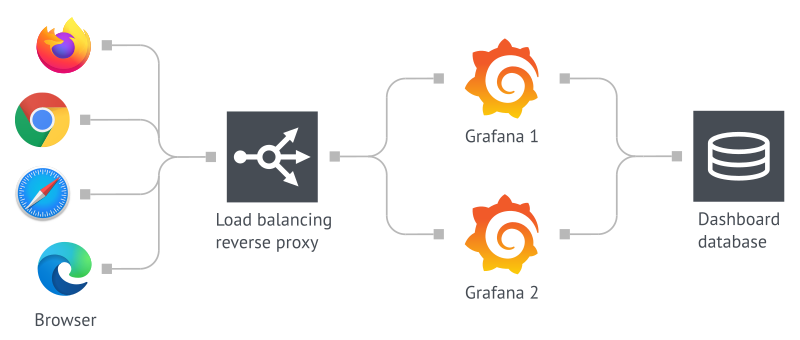
Configure multiple servers to use the same database
First, you need to set up MySQL or Postgres on another server and configure Grafana to use that database. You can find the configuration for doing that in the [database] section in the Grafana config. Grafana will now persist all long term data in the database. How to configure the database for high availability is out of scope for this guide. We recommend finding an expert on the database you’re using.
Alerting high availability
Grafana alerting provides a new highly-available model. It also preserves the semantics of legacy dashboard alerting by executing all alerts on every server and by sending notifications only once per alert. Load distribution between servers is not supported at this time.
For instructions on setting up alerting high availability, see Enable alerting high availability.
Legacy dashboard alerts
Legacy Grafana Alerting supports a limited form of high availability. In this model, alert notifications are deduplicated when running multiple servers. This means all alerts are executed on every server, but alert notifications are only sent once per alert. Grafana does not support load distribution between servers.
Grafana Live
Grafana Live works with limitations in highly available setup. For details, refer to the Configure Grafana Live HA setup.
User sessions
Grafana uses auth token strategy with database by default. This means that a load balancer can send a user to any Grafana server without having to log in on each server.
Was this page helpful?
Related resources from Grafana Labs



